
Bill Grayson manages livestock and land for biodiversity in north-east England. He shares his experience of using different greenhouse gas (GHG) calculators.
About us
Our business is a collection of bits of land that are mostly owned by conservation bodies. These bodies don’t want to own livestock themselves, but animals are still needed to graze the habitats to maintain their value for wildlife. And so for the last 30 years we have filled that role. We have built a system that consists of many parcels of nature reserve, all different habitat – grassland, salt marsh, limestone, fen, reed bed – you name it, we’ve pretty well got it. And there are lots of trees – it’s a very wooded area. And so we’re interested in how much carbon is being removed by the growth of all this woody biomass.
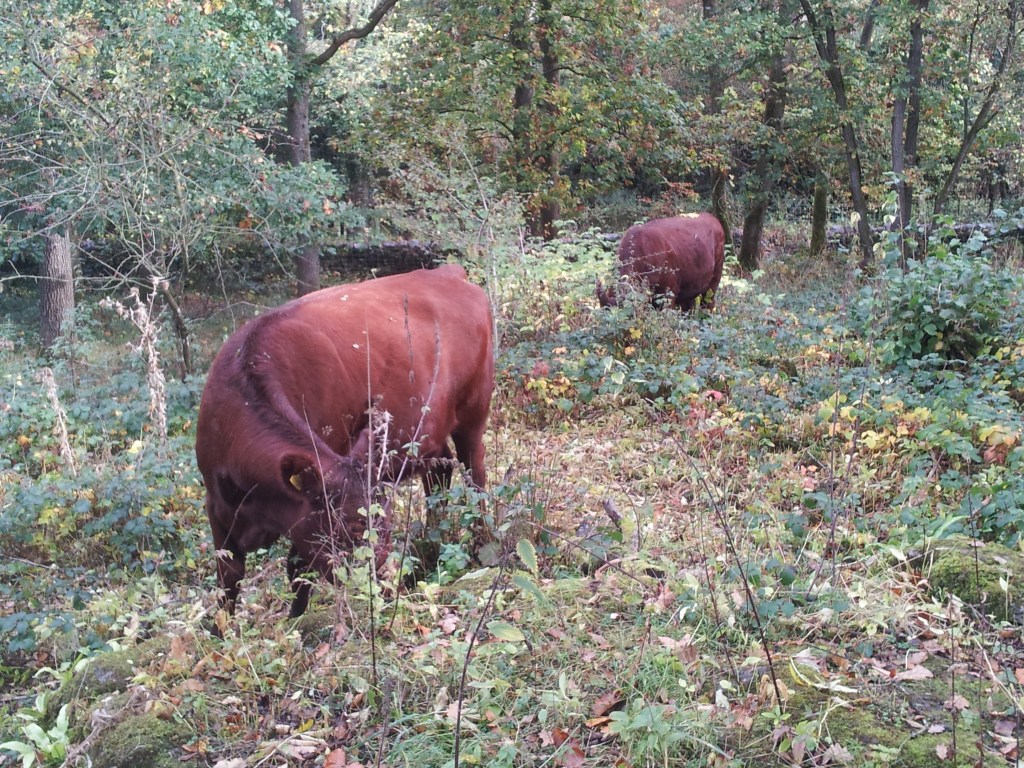
We have a handful of sheep for some of the smaller areas that are grazed, but for the most part it’s a suckler cow system of pedigree Red Polls. We’re organic and ‘Pasture for Life’ so as low input as a system can be.
First Footprinting steps
In 2010, EBLEX (now AHDB Beef & Lamb) published their first Roadmap.[1] It was focused on GHG emissions. Some of the options offered e.g. giving your animals a better quality diet weren’t available to us – we have to make do with the types of grassland that are being managed for nature conservation by our landlords, which have to be grazed in a way that maintains biodiversity.
The more I thought about it, the more I thought about our system. We’re not just producing beef and lamb, we’re producing lots of other goods to benefit society. That’s what got me interested. So I contacted the organisation that had done the GHG assessments for EBLEX and I got them to come and do that calculation for us. Sure enough, our emissions were more than twice the average calculated for an upland suckler beef system. This came as no surprise because nearly all those emissions were methane produced by animals on a diet that was much higher in fibre and meant that they took about twice as long to be ready for market.
Moving on – emissions and removals
I then moved on to another tool which included estimates of sequestration that occurs in the soil under the feet of the animals and in the trees and other woody biomass around them. I felt that this was going to be a more appropriate method of assessment for our system, since it includes many of these features that are known to be important carbon sinks, something that would obviously reduce the system’s overall footprint. This proved to be the case, indicating that the estimated levels of sequestration were able to offset the emissions from livestock by a factor of three. The message that I got from this was that you should think carefully about which tool you choose. I thought then, and still do now, that it is very important that assessments of systems like ours, that are sustained by the natural productivity of the land itself, should be based on net emissions rather than gross emissions alone.
Taking the debate to Westminster
Then in 2013 I was invited by the All Party Parliamentary Group (APPG) for Beef and Lamb to talk to them during their inquiry on the carbon footprint of beef and sheep.[2] After this I felt that I’d done my bit to try and clarify this issue and that someone in authority would, at some point, be able to resolve it by issuing much clearer guidance on the best approach to take when assessing emissions from grazing livestock.
The bigger picture
Recently, however, I became aware of advice being given to nature reserve managers that they should switch from using cattle and sheep to graze their sites and use ponies or other non-ruminants instead. This advice was based entirely on the methane emissions produced by the animals themselves.
I was really disappointed about this because we had already shown that different livestock species, cattle and ponies, have different roles when it comes to grazing conservation sites and they are not directly interchangeable without affecting the quality of the habitat.
On one of the main sites we graze there was a move to ponies to improve the grazing system’s GHG footprint. However this hindered delivery of its biodiversity objectives to such an extent that the site manager decided to remove the ponies and extend the cattle grazing over the entire area.
Subsequently, we turned to a tool which aims to assess overall sustainability performance across a broader range of public goods measures rather than focussing on only climate impact. Our system scored highly on biodiversity, soil health, water quality and community benefits but less well in terms of food security. This more joined-up approach feels to me to be a particularly valuable method of farm sustainability assessment allowing the synergies and trade-offs between the various public goods parameters to be assessed in a more balanced way.
Why LUNZ Footprint?
I joined the project in part because I wanted to contribute to research efforts that would help everyone to better understand the difference between calculators and why they generate different results.
I am seeing how LUNZ Footprint can bring all the questions together in a way that allow us to make some sensible decisions about these things.
I am already seeing some of these benefits in the form of new data for my own system, the latest results of which strongly support my view about the importance of including sequestration in the assessment. These show that using cattle to graze amongst trees can provide a significant net sink in terms of CO2e, because the calculated emissions from the animals are far outweighed by the calculated removals linked to the woodland and other semi-natural habitats in which they are reared.
I hope that sharing this message more widely within the conservation community will help to reassure nature reserve managers that their choice of livestock for delivering the required grazing regimes should not focus on emissions alone, but holistic assessments including the role of sequestration.
[1] Roadmap 1: change in the air | AHDB
[2] APPG Beef and Lamb footprinting

