25 February 2025
The first LUNZ Footprint feedback meeting involved everyone in our Living Lab – farmers, researchers, calculator companies and advisers.
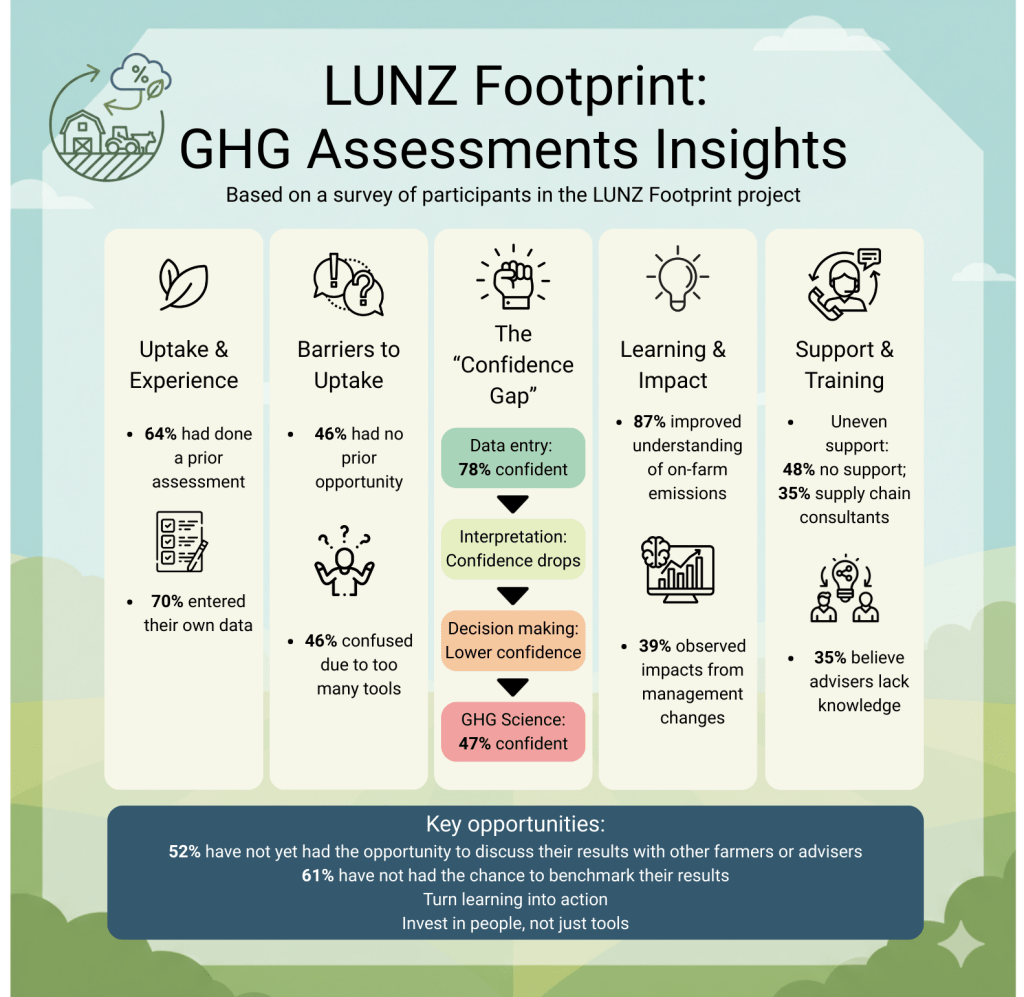
Attendees heard about early survey results which suggest that farmers in the project generally feel confident entering data and that many have improved their understanding of farm emissions.
Learning by doing: farmers GHG footprinting experiences
Two farmers (one dairy, one arable) talked about their experiences of GHG footprinting and agreed that the big challenges are pulling data together and lack of time to do this and the assessment.
‘Time is a massive challenge.’
Dairy farmer, Wales
They both felt that the assessment process gets much easier if information is recorded little and often through the year, using simple spreadsheets or existing farm records. Top tips were to keep things simple, focus on the biggest inputs, and use the calculator in the same way every year so a comparison can be made from year to year.
‘Keep it simple to start with. It’s easy to get bogged down in all the detail, but ultimately you can pick out the important sections which you know are probably going to be the big areas in the business and work with those first. And from there you can build.’
Arable farmer, South of England
‘It’s a bit like the financial side of life. You know the more you can keep on top of it on a monthly basis, the less heartache it is when you need to sit down for the accountant.’
Dairy farmer, Wales
Initial analysis
Initial analysis of some farm footprints by the project confirmed that most emissions come from livestock and major inputs such as feed, fuel, and fertiliser. At the same time, project farms are producing large amounts of food and storing carbon in the land. Results therefore need to be considered carefully, looking at emissions per farm, per hectare, and per unit of food produced. It was also felt that GHG results should not be looked at in isolation, but alongside wider benefits like biodiversity, land management, and social value, and that tools and policies need to reflect this broader picture.
Attention turned back to data and those which have the most impact on a farm or product GHG footprint. Having information on livestock numbers and weights is a good start but one example showed that by collecting a little extra information on feed for the same herd, with everything else being equal, reduced calculated enteric methane and manure-based emissions by 23%.
‘‘Remember, you can always go back and amend things.’
Arable farmer, South of England
Common challenges
Farmers asked many questions about the ability of tools to compare different systems, the treatment of methane and noted that not all ‘grass’ is the same. Calculator companies at the meeting described the balance they have to achieve in ensuring that they have good robust evidence to include a practice in their model whilst also representing the progress made by farmers and innovations taken up. Some farmers reported their experiences of different customers and schemes using different tools and others of their struggles with data collection.
I find the information required and recording so daunting and I am very time poor so not sure how to start.’
Mixed farmer, South of England
This valuable session highlighted why some farmers chose to join the project: to help improve the current process by sharing their reflections and contributing to better data collection and tools.
Read more about our Living Lab approach here.
